gatus A service health dashboard in Go that is meant to be used as a docker image with a custom configuration file.

Features
The main features of Gatus are:
- Highly flexible health check conditions: While checking the response status may be enough for some use cases, Gatus goes much further and allows you to add conditions on the response time, the response body and even the IP address.
- Ability to use Gatus for user acceptance tests: Thanks to the point above, you can leverage this application to create automated user acceptance tests.
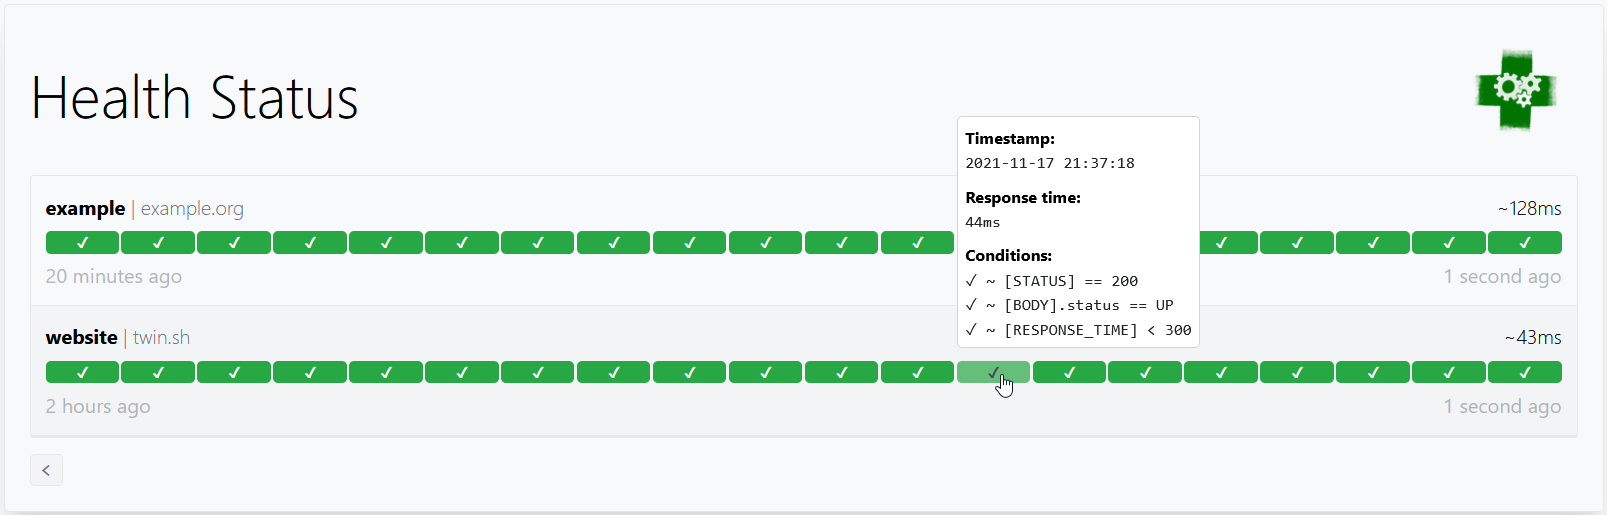
- Very easy to configure: Not only is the configuration designed to be as readable as possible, it’s also extremely easy to add a new service or a new endpoint to monitor.
- Alerting: While having a pretty visual dashboard is useful to keep track of the state of your application(s), you probably don’t want to stare at it all day. Thus, notifications via Slack, PagerDuty and Twilio are supported out of the box with the ability to configure a custom alerting provider for any needs you might have, whether it be a different provider or a custom application that manages automated rollbacks.
- Metrics
- Low resource consumption: As with most Go applications, the resource footprint that this application requires is negligibly small.
Example
By default, the configuration file is expected to be at config/config.yaml.
metrics: true         # Whether to expose metrics at /metrics
services:
  - name: twinnation  # Name of your service, can be anything
    url: "https://twinnation.org/health"
    interval: 30s     # Duration to wait between every status check (default: 60s)
    conditions:
      - "[STATUS] == 200"         # Status must be 200
      - "[BODY].status == UP"     # The json path "$.status" must be equal to UP
      - "[RESPONSE_TIME] < 300"   # Response time must be under 300ms
  - name: example
    url: "https://example.org/"
    interval: 30s
    conditions:
      - "[STATUS] == 200"