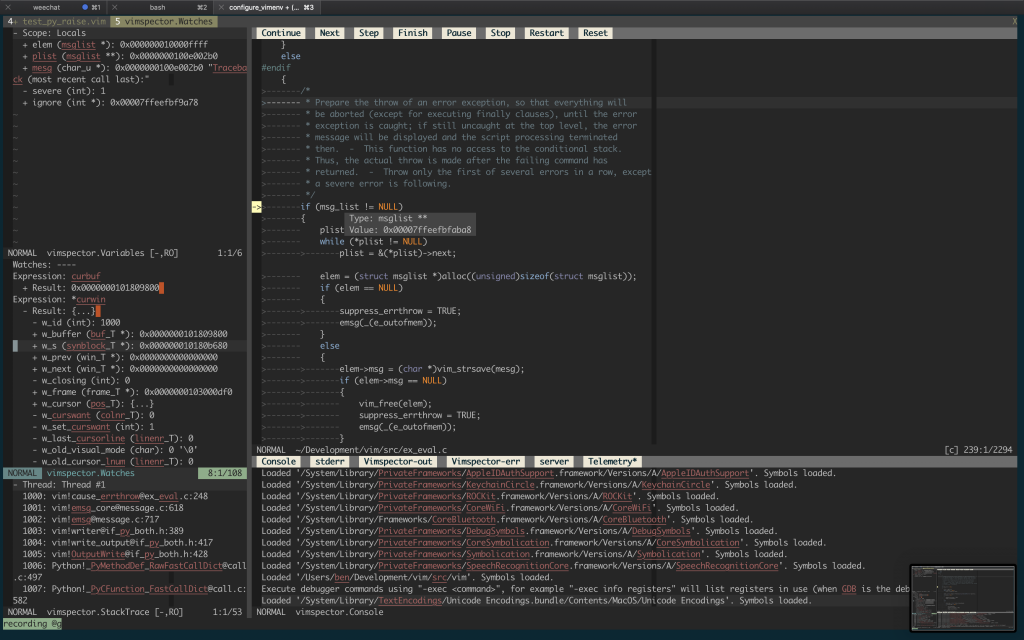
Vimspector: The plugin is a capable Vim graphical debugger for multiple languages. It’s mostly tested for c++, python and TCL, but in theory supports any language that Visual Studio Code supports (but see caveats).
Supported debugging features
- flexible configuration syntax that can be checked in to source control
- breakpoints (function, line and exception breakpoints)
- conditional breakpoints (function, line)
- step in/out/over/up, stop, restart
- launch and attach
- remote launch, remote attach
- locals and globals display
- watch expressions
- call stack display and navigation
- variable value display hover
- interactive debug console
- launch debugee within Vim’s embedded terminal
- logging/stdout display
- simple stable API for custom tooling (e.g. integrate with language server)
Supported languages:
The following languages are used frequently by the author and are known to work with little effort, and are supported as first-class languages.
- C, C++, etc. (languages supported by gdb or lldb)
- Python 2 and Python 3
- TCL
- Bash scripts
- Java
Languages known to work
The following languages are used frequently by the author, but require some sort of hackery that makes it challenging to support generally. These languages are on a best-efforts basis:
- C# (c-sharp) using dotnet core
- Go (requires separate installation of Delve)
- Node.js (requires node <12 for installation)
- Anything running in chrome (i.e. javascript).
Languages known not to work
- C# (c-sharp) using mono debug adapter (vimspector unable to set breakpoints)