Sampler is a tool for shell commands execution, visualization and alerting. Configured with a simple YAML file.
Usage
You specify shell commands, Sampler executes them with a required rate. The output is used for visualization.
One can sample any dynamic process right from the terminal – observe changes in the database, monitor MQ in-flight messages, trigger deployment process and get notification when it’s done.
Using Sampler is basically a 3-step process:
- Define your configuration in a YAML file
- Run
sampler -c config.yml - Adjust components size and location on UI
Runchart
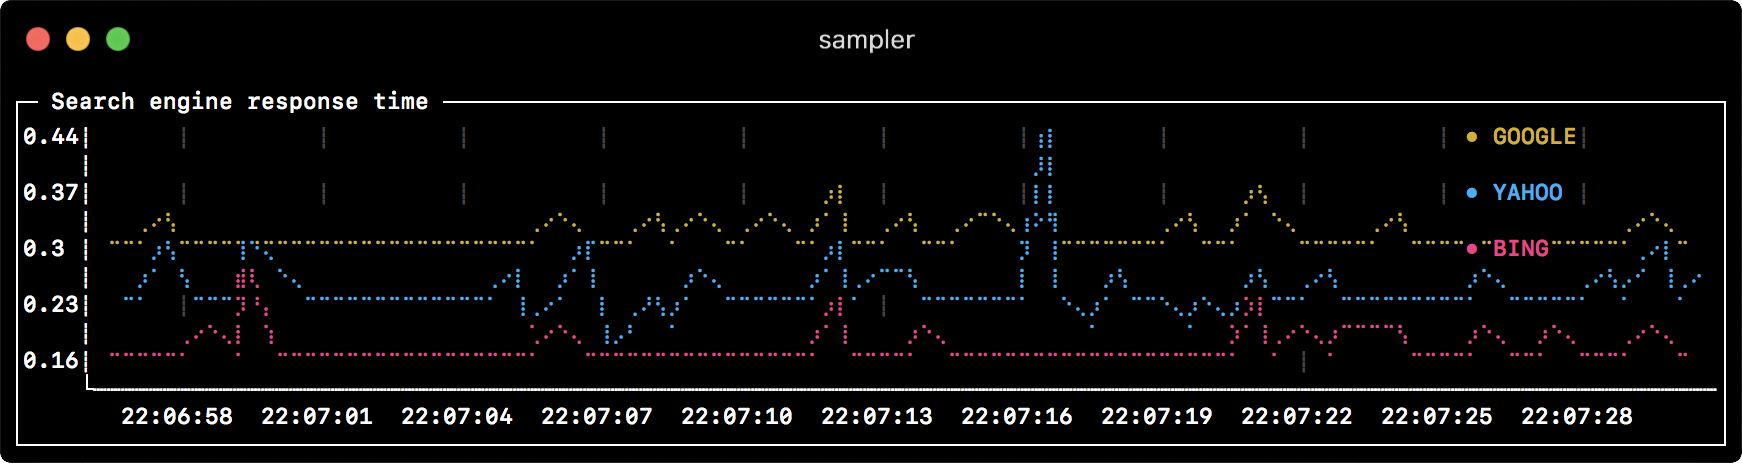
runcharts:
  - title: Search engine response time
    rate-ms: 500        # sampling rate, default = 1000
    scale: 2            # number of digits after sample decimal point, default = 1
    legend:
      enabled: true     # enables item labels, default = true
      details: false    # enables item statistics: cur/min/max/dlt values, default = true
    items:
      - label: GOOGLE
        sample: curl -o /dev/null -s -w '%{time_total}'  https://www.google.com
        color: 178      # 8-bit color number, default one is chosen from a pre-defined palette
      - label: YAHOO
        sample: curl -o /dev/null -s -w '%{time_total}'  https://search.yahoo.com
      - label: BING
        sample: curl -o /dev/null -s -w '%{time_total}'  https://www.bing.com
Sparkline
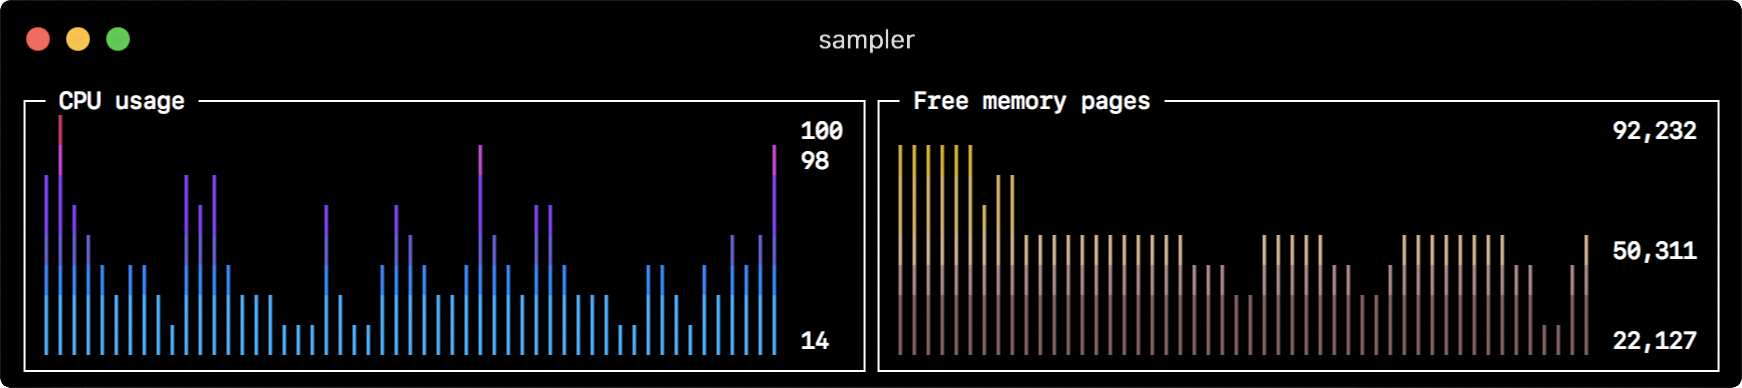
sparklines:
  - title: CPU usage
    rate-ms: 200
    scale: 0
    sample: ps -A -o %cpu | awk '{s+=$1} END {print s}'
  - title: Free memory pages
    rate-ms: 200
    scale: 0
    sample: memory_pressure | grep 'Pages free' | awk '{print $3}'